Katherine Nguyen

Data Scientist | Data Analyst

Welcome, my name is Katherine. I'm an aspiring data scientist and data analyst with a Master's in Data Science from CU Boulder, passionate about turning complex data into meaningful insights that inform smarter decisions. Through hands-on academic projects and internships, I've explored evidence-based policy, dashboard design, and data storytelling to make information more accessible. I'm excited to continue growing and contribute to teams where data makes a real impact.

Kath Nguyen Img.

⊱ ⋅About⋅ ⊰

Kath Nguyen About Me Img.

Get to Know Me

Curious by Nature, Data by Choice

Welcome! My name is Katherine but I also go by Kath. I am an aspiring data scientist and analyst with a passion for storytelling, learning, and purpose-driven work. I believe that data and empathy are two of the most powerful tools to create meaningful change, especially in fields like healthcare and public health.


Most days, you'll find me working in Jupyter or Colab, turning messy data into clear insights. I enjoy analyzing healthcare data, diving into racing stats, and exploring unfamiliar datasets that spark my curiosity. I use tools like Python, R, SQL, Power BI, and Tableau to clean data, run analysis, build dashboards, and apply machine learning.


I've worked on a range of academic and personal projects, from evidence-based policy analysis at the Colorado Governor's Office to independent explorations of health data and Formula 1 data (yes, I'm a big F1 fan! Stay tuned when the project is complete!). Whether it's mapping patient trends, racing through drivers stats, or diving into something completely new, I value discovering new insights and data-driven stories.


Feel free to poke around and if you have any questions or wish to reach out, let's connect!

⊱ ⋅Projects⋅ ⊰

Explore my data science projects showcasing skills in machine learning, data analysis, and visualization. Each project demonstrates my approach to solving real-world problems with data.

Project Feature Image

Featured Project

Predicting Diabetes Risk Through Deep Learning

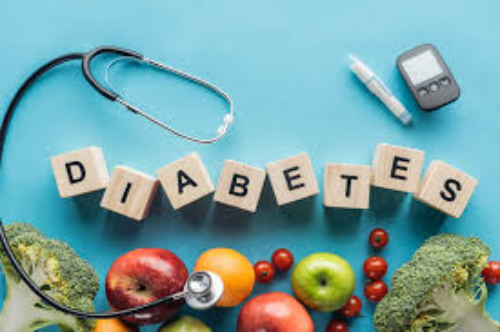
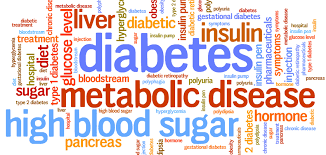
I led the development of a deep learning solution to predict diabetes risk using uncorrelated health indicators. I evaluated both Feedforward Neural Networks (FNN) and Convolutional Neural Networks (CNN), utilizing Random Forest for feature selection. The FNN achieved 87.5% accuracy, outperforming CNN and demonstrating strong predictive power for independent health variables despite minor overfitting. This project showcases my skills in deep learning model evaluation, feature selection, and health data analysis.

Project 1 Image
PYTHON PYTHON SCIKIT-LEARNSCIKIT-LEARN COLAB COLAB

Pima Indians Diabetes Predictive Analysis
Applications: XGBoost, SVM, MLPClassifier, Cross-Validation, Confusion Matrix

Pima Indians Diabetes Predictive Analysis

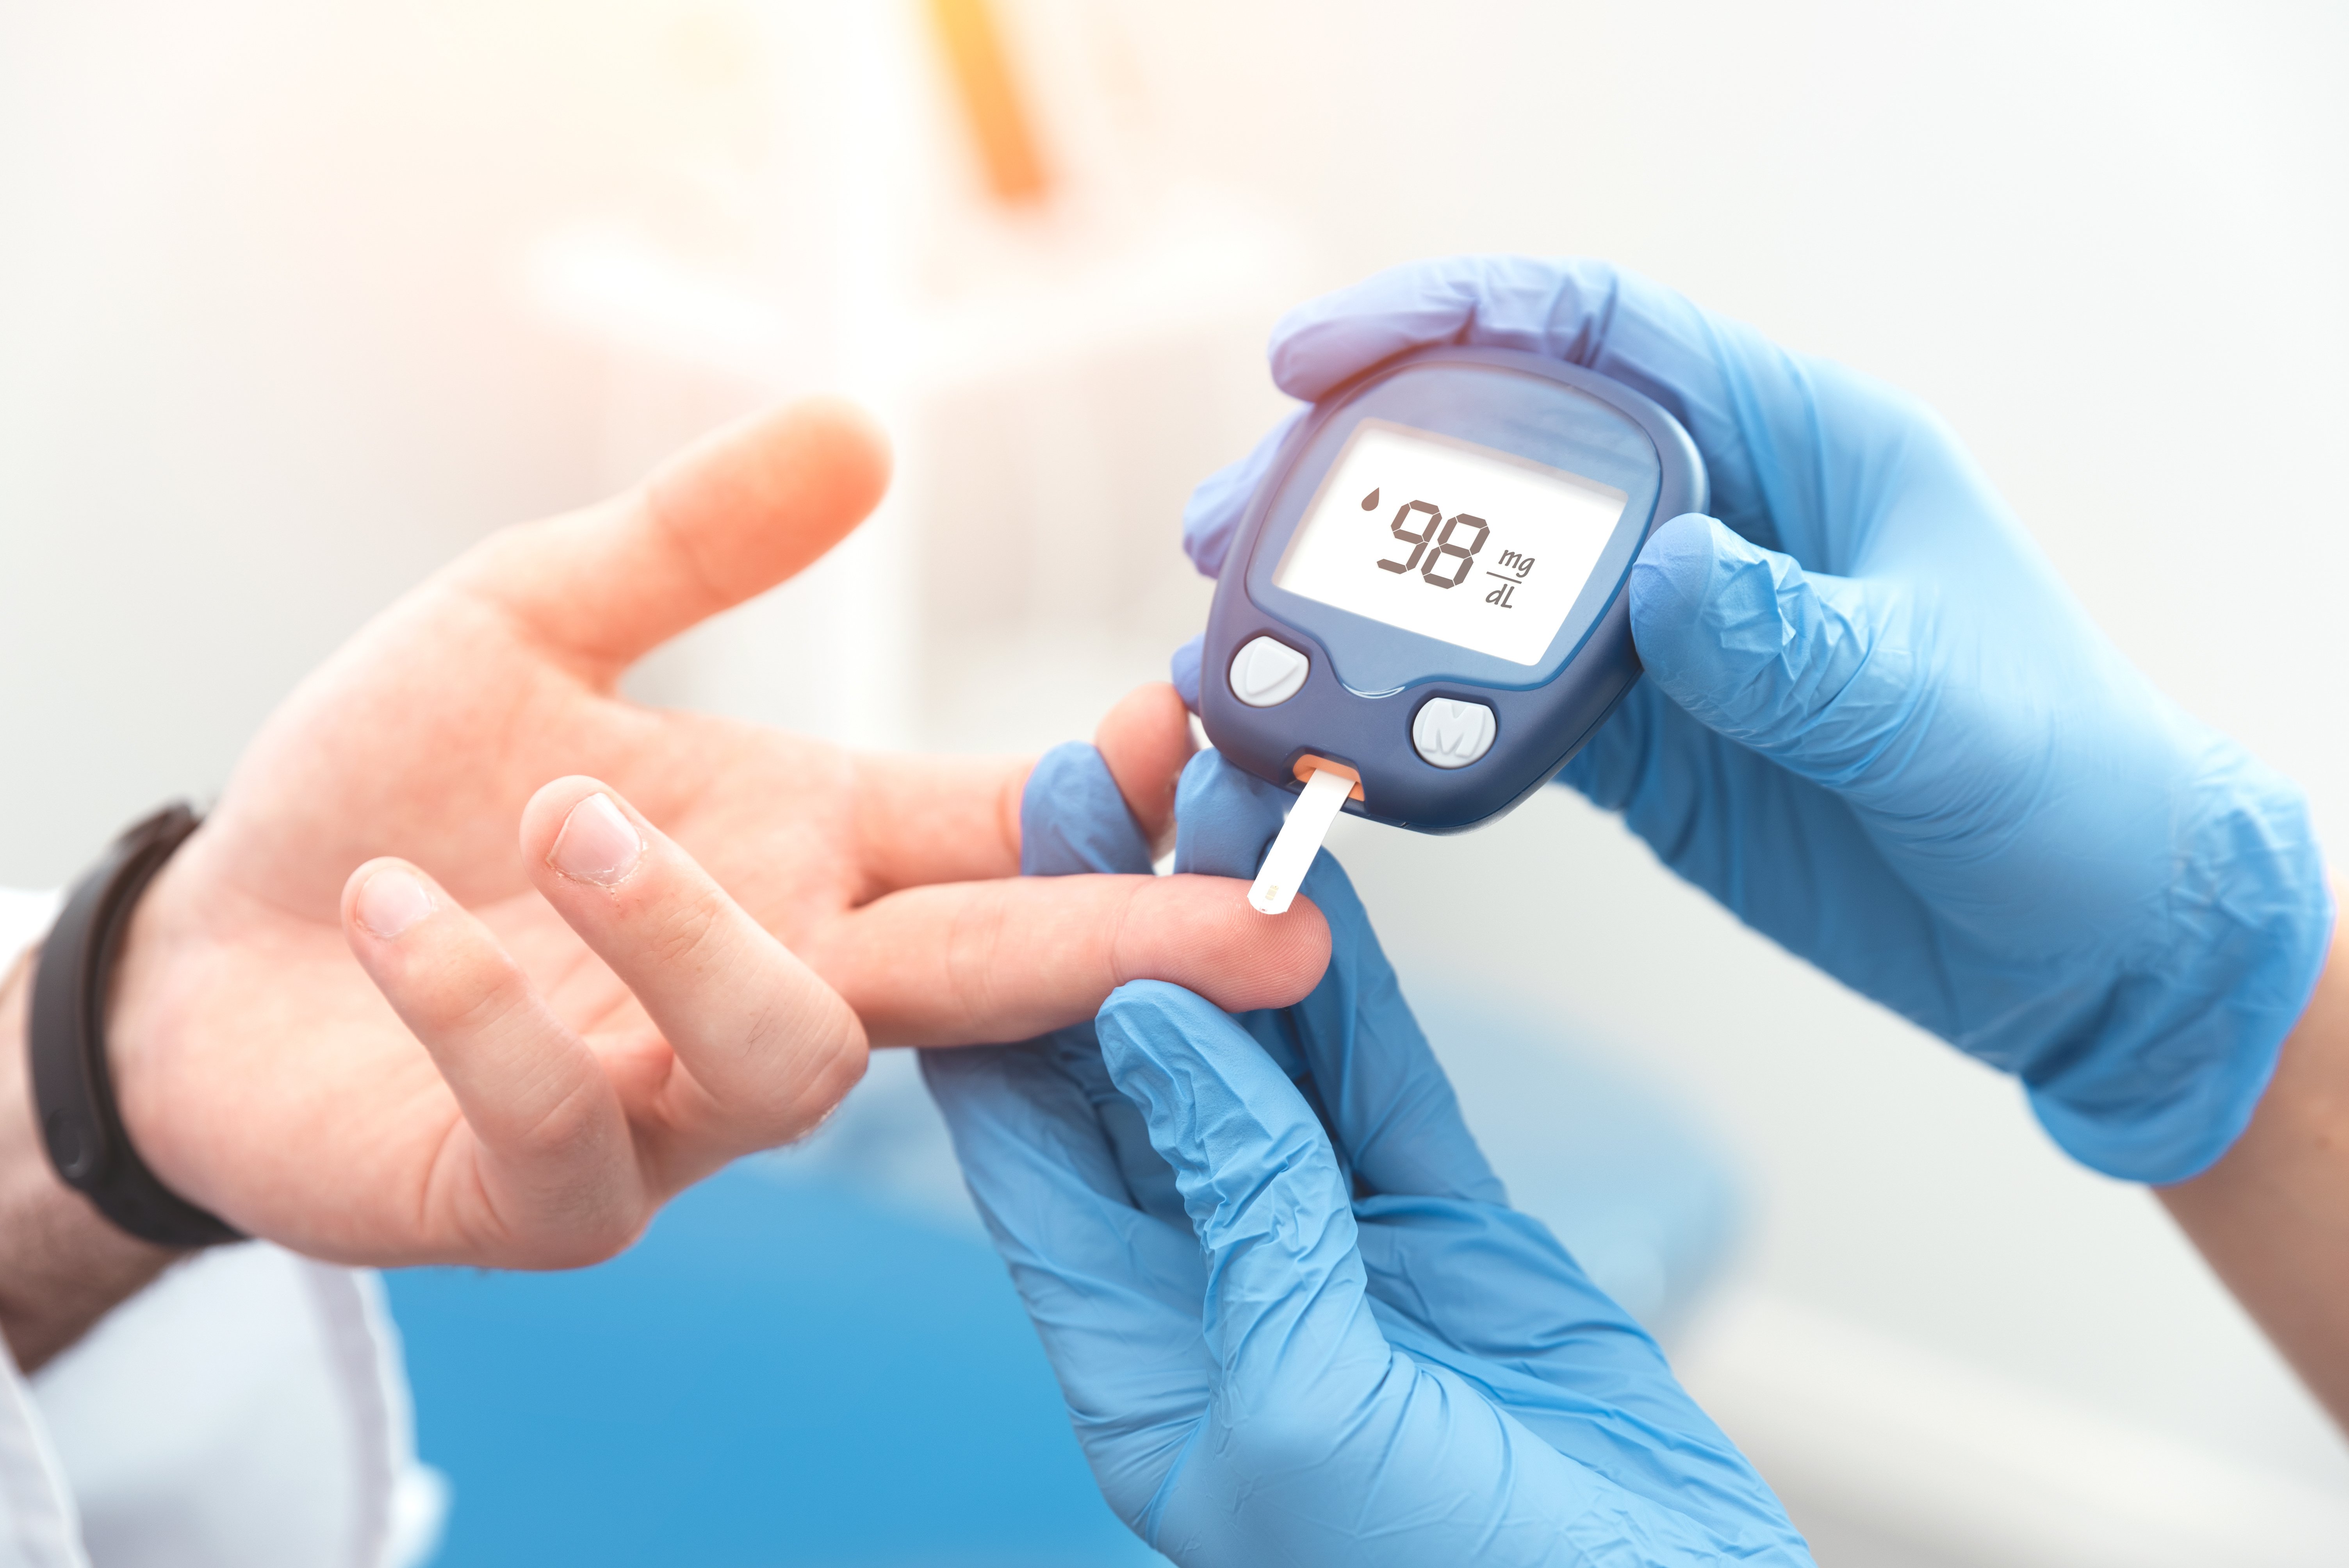
Overview: Conducted predictive analysis on the Pima Indians Diabetes dataset to detect early signs of diabetes using lab-derived indicators such as glucose, insulin, blood pressure, age, and BMI. Applied data mining pipeline steps including feature selection, correlation analysis, cross-validation, and multiple classification models to evaluate predictive performance. Results confirm that lab work and characteristic features can be used to identify predisposed individuals for early detection and intervention.

Results: Achieved 70.5% accuracy, 75.7% precision, and 77.2% F1-score using SVM, with Decision Tree and XGBoost further supporting that glucose, insulin, and blood pressure are key predictors of diabetes.

Project 2 Image
PYTHON PYTHON TENSORFLOW TENSORFLOW KERASKERAS KAGGLE KAGGLE

Monet GAN Image Generation
Applications: DCGAN, TPU, Image Augmentation

Monet GAN Image Generation

Overview: Trained a Deep Convolutional GAN (DCGAN) model using the "I'm Something of a Painter Myself" Kaggle dataset to generate Monet-style paintings from real-world photo inputs. Data preprocessing involved image augmentation, resizing, and scaling, with modeling supported by TPU acceleration for performance.

Results: Generated Monet-inspired image transformations, though full training was interrupted by TPU limitations. Despite this, Model demonstrated strong artistic potential.

Project 3 Image
PYTHON PYTHON TENSORFLOW TENSORFLOW KERASKERAS KAGGLE KAGGLE

Predicting Diabetes Risk Through Deep Learning
Applications: FNN, CNN, Random Forest (feature selection)

Predicting Diabetes Risk Through Deep Learning

Overview: Evaluated two deep learning architectures, the Feedforward Neural Network (FNN) and the Convolutional Neural Network (CNN), to predict diabetes risk from uncorrelated health indicators. Feature selection was done via Random Forest, focusing on Polyuria, Polydipsia, Gender, Sudden Weight Loss, and Partial Paresis.

Results: Achieved 87.5% accuracy with FNN, which outperformed CNN, indicating it is better fit to work with independent features. Despite signs of overfitting, FNN demonstrated strong potential in modeling diabetes risk from uncorrelated health variables.

Project 4 Image
PYTHON PYTHON SCIKIT-LEARNSCIKIT-LEARN KAGGLE KAGGLE

Predicting Diabetes Risk Through Unsupervised Learning
Applications: K-Means, Hierarchical Clustering, PCA, NMF, Silhouette Score

Predicting Diabetes Risk Through Unsupervised Learning

Overview: Applied K-Means and Hierarchical Clustering on patient data to identify individuals at risk for diabetes without using labeled outcomes. Reduced dimensionality with NMF before clustering and evaluated model performance using accuracy, precision, confusion matrices, and silhouette scores.

Results: Achieved 81.7% accuracy and 96.3% precision with Hierarchical Clustering as well as a 80.5% accuracy and 96.7% precision for K-Means Clustering, indicating these are high potential methods for evaluating diabetes risks. However, low silhouette scores (<0.45) indicated weak intra-cluster similarity.

Project 5 Image
PYTHON PYTHON SCIKIT-LEARNSCIKIT-LEARN KAGGLE KAGGLE

Predicting Diabetes Risk Through Supervised Learning
Applications: Logistic Regression, Decision Tree, Learning Curves, Confusion Matrix

Predicting Diabetes Risk Through Supervised Learning

Overview: Built two predictive models, a Logistic Regression and a Decision Tree Classifier, in order to identify diabetes risk, based on symptoms and health indicators such as: age, gender, polyuria, and partial paresis. Evaluated performance using accuracy, precision, confusion matrices, and learning curves.

Results: Achieved 94.2% accuracy with Decision Tree and 93.3% with Logistic Regression, demonstrating two models that could effectively predict diabetes risks.

Project 6 Image
PYTHON PYTHON NUMPY NUMPY PANDAS PANDAS SEABORN SEABORN KAGGLE KAGGLE

Disaster Tweets Classification
Applications: Python, NumPy, pandas, Seaborn, Matplotlib, TensorFlow/Keras, CNN, RNN (LSTM), Kaggle

Disaster Tweets Classification

Overview: Used NLP and deep learning to classify tweets as real or fake disaster alerts. Compared CNN vs. RNN (LSTM) deep learning models to classify tweets as real disaster-related posts or not. Used Keras for model design and Tokenizer for preprocessing.

Results: Achieved a Kaggle score of 0.56 with CNN, which slightly outperformed RNN. However, both models underperformed due to CNN overfitting and RNN failing to learn effectively. Future improvements include better hyperparameter tuning and more complex layer configurations.

Project 7 Image
R R TIDYVERSE TIDYVERSE JUPYTER JUPYTER

NYPD Shooting Incident Data Analysis
Applications: R, tidyverse, lubridate, data wrangling, exploratory data visualization

NYPD Shooting Incident Data Analysis

Overview: Analyzed 15 years of NYPD shooting incident data to investigate how borough location, race, and sex affect the likelihood of becoming a shooting victim in NYC. Built visualizations and performed trend modeling to assess patterns over time and across demographics.

Results: Found that sex was the most influential factor, with males consistently at higher risk, while race and location showed minimal predictive power. Despite Brooklyn and the Bronx having more shootings, these were proportional across boroughs and years.

Project 5 Image
R R TIDYVERSE TIDYVERSE GGPLOT GGPLOT RSTUDIO RSTUDIO

Analysis of Covid-19 Death Rates by Continent
Applications: Exploratory Data Analysis, Data Wrangling

Analysis of Covid-19 Death Rates by Continent

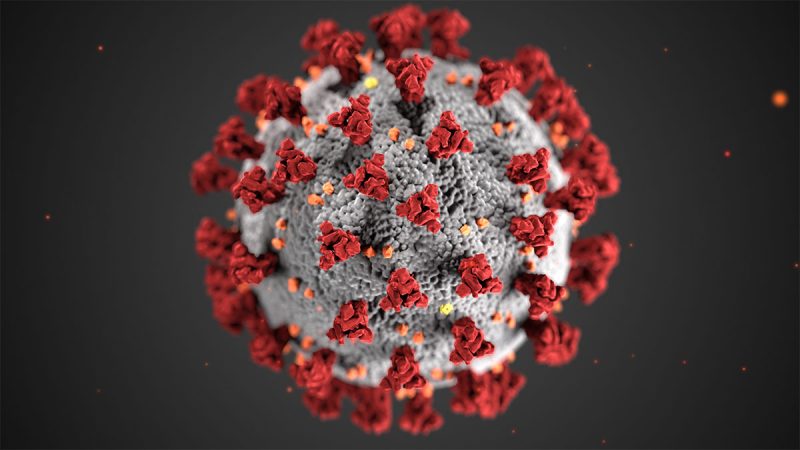
Overview: Analyzed Covid-19 death rates across continents using April 2021 data to explore the relationship between death rates and various socioeconomic and health indicators: population density, extreme poverty, elderly population, hospital beds, life expectancy, cardiovascular death rates, and diabetes prevalence. Investigated trends through visualizations including univariate, bivariate, and multivariate analyses.

Results: Explored 7 variables across continents found that age (especially those 70 and over), diabtes prevalence, and extreme povertywere most correlated with Covid-19 death rates via correlation by differing continents.

⊱ ⋅Skills⋅ ⊰

Explore my technical skills in Python, R, SQL, and more. Each skill card shows my experience and key libraries I use for data analysis and machine learning.

Python

Python

Key Libraries: pandas, NumPy, matplotlib, Seaborn, scikit

I used Python extensively for data analysis, machine learning, and statistical modeling. My projects included predictive analytics, data visualization, and automated reporting systems. Python's versatility allowed me to handle large datasets efficiently while creating interactive dashboards and implementing complex algorithms for pattern recognition and forecasting.

R

R

Key Libraries: dplyr, ggplot2, tidyr

I used R for advanced statistical analysis, data wrangling, and creating publication-quality visualizations. R was essential for hypothesis testing, regression modeling, and exploratory data analysis in academic research and coursework, especially when working with complex or messy datasets.

SQL

SQL

Databases: PostgreSQL

I used SQL to design, query, and manage relational databases. My experience includes writing complex queries for data extraction, transformation, and reporting, as well as optimizing database performance and ensuring data integrity for analytics projects and dashboards.

← Back Project 1 Project 2 Project 3

⊱ ⋅Certifications⋅ ⊰

View my professional certifications and academic achievements in data science and analytics. These credentials validate my expertise and commitment to continuous learning.

IBM Data Analyst Certificate

IBM Certificate

Strengthening foundational data analysis and business insight skills.

Working with hands-on projects using Python, SQL, Excel, and Jupyter to clean, analyze, and visualize real-world datasets.

Microsoft Power BI Data Analyst

Power BI Certificate

Establishing foundational skills in creating interactive dashboards for business insights and data visualization.

Working on hands-on projects using Power BI to build dashboards, transform data with Power Query, and write DAX formulas to derive key metrics and business KPIs.

Data Science Graduate Certificate

CU Boulder Certificate

Building skills in supervised and unsupervised learning, statistical modeling, and data visualization using Python and R.

Applying theory through hands-on projects focused on public and health data analysis.

⊱ ⋅Work Experience⋅ ⊰

Explore my technical skills in Python, R, SQL, and more. Each skill card shows my experience and key libraries I use for data analysis and machine learning.

CU Boulder Certificate

Evidence-Based Policy (EBP) Intern

Colorado Governor's Office of State Budgeting and Planning (OSPB) | Denver, CO

  • Evaluated 10+ department decision items and funding proposals with Evidence-Based Policy Analyst, using tax records and historical spending data, directly contributing to state-level funding recommendations for FY22.
  • Designed user guidelines for the EBP application using Google Workspace, enhancing usability and ensuring seamless adoption across departments
  • internal memos summarizing cost-saving strategies and findings, directly contributing to a $500K cost reduction in FY22 budgeting.